BEIJING, Sept. 28, 2020 /PRNewswire/ — A news report from China.org.cn:
The 2020 Beijing Cultural Industry Development Conference, organized by the Publicity Department of the CPC Beijing Municipal Committee, was held on Sept. 6, as part of a featured event at the 2020 China International Fair for Trade in Services (CIFTIS). Zhou Muzhi, president of Cloud River Urban Research Institute and professor of Tokyo Keizai University, delivered a keynote speech titled "A look at Beijing’s cultural industry development from its culture, sports and entertainment radiation," giving his insights into the good practices and new challenges of the city’s cultural industry. This article is a further elaboration on the topic based on his speech.
.")
The 2020 Beijing Cultural Industry Development Conference is held on Sept. 6, as part of a featured event at the 2020 China International Fair for Trade in Services (CIFTIS).
1. 2019 ranking on culture, sports and entertainment radiation of Chinese cities
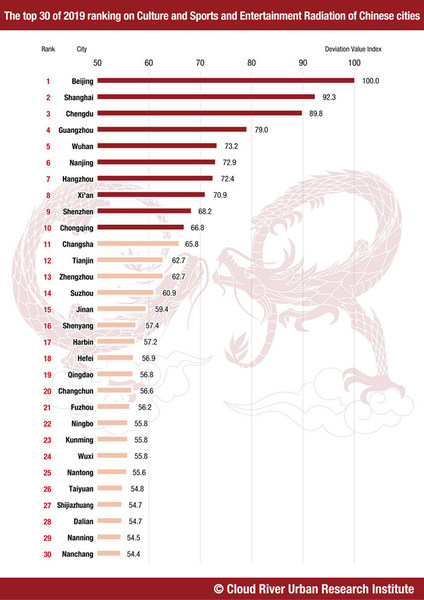
As part of the China Integrated City Index, the Cloud River Urban Research Institute has released the 2019 ranking on culture, sports and entertainment radiation based on a research of 297 cities at prefecture level or above across China. The top 10 are Beijing, Shanghai, Chengdu, Guangzhou, Wuhan, Nanjing, Hangzhou, Xi’an, Shenzhen and Chongqing. Beijing takes an overwhelming lead in the rank.
The next 10 cities in the top 20 are Changsha, Tianjin, Zhengzhou, Suzhou, Jinan, Shenyang, Harbin, Hefei, Qingdao and Changchun. Following them, Fuzhou, Ningbo, Kunming, Wuxi, Nantong, Taiyuan, Shijiazhuang, Dalian, Nanning, and Nanchang round out the top 30.

The top 30 of 2019 ranking on culture, sports and entertainment radiation of Chinese cities
Jointly developed by Cloud River Urban Research Institute and the Development Planning Department of the National Development and Reform Commission (NDRC), China Integrated City Index is a system that evaluates growth performance of 297 cities at prefecture level or above across the country. The institute has been publishing the city index annually since 2016. Available in Chinese, Japanese and English, the index measures urban development in three dimensions: the environment, society and economy. Under each dimension lies many indicators that support its sub-dimensions at different layers. The culture, sports and entertainment radiation is a group of indicators supported by 785 data sets, with 29.2% coming from statistical data, 30.8% from satellite remote sensing data, and 40% from internet data.
The radiation index measures a city’s capacity in providing goods and services in certain areas. A high radiation score means the city has the capacity to sell its goods and services, while a low radiation score means that it needs to purchase certain goods and services from other places.
2. Beijing’s overwhelming lead in cultural and entertainment industry
2019 ranking in culture, sports and entertainment radiation of Chinese cities is composed of three modules: returns and traffic, facilities and human resources. On returns and traffic, total revenues of the cultural and entertainment industry in top 30 cities in the ranking account for 67.9% that of the whole country. That is to say, the top 10% cities account for nearly 70% of the country’s total revenues in the industry. Beijing even takes a staggering 24.8%, or nearly a quarter, of the total revenue, reflecting the city’s overwhelming lead in the cultural industry.
Other statistics in the returns and traffic module follow the same logic. The top 30 cities account for 54.5% of China’s box office, 52% of the total movie attendance, and 46% of the country’s total museum and gallery visits, with Beijing taking 5.7%, 4.5% and 6.9%, respectively.
The top 30 cities also boast 72.3% of all the related facilities or industry assets in China, with Beijing taking over a quarter (26.4%) of the total.
Specifically, the top 30 account for 34.9% of all the theaters, 46.8% of all the galleries, 38.6% of all the museums, 84.2% of all the ancient relics, 37.1% of all the sports venues, and 53.7% of all the public libraries, with Beijing taking 2.7%, 6.4%, 3.4%, 46.6%, 2.7% and 6.6% of them respectively.
On human resources, the top 30 boast 53.3% of all professionals and 48.2% of the business entities and organizations of the cultural and entertainment industry, with Beijing taking 12.8% and 10.4% respectively.
Why Beijing can reap a quarter of the national total revenue in the cultural industry with only 12.8% of all its human resources? The reasons lie in its high quality facilities, which accounted for a quarter of the country’s total, as well as its highly concentrated top talents in the field.
According to statistics, the top 30 cities are home to 95.9% of all the national A-class performing artists, 75.1% of all the A-class art designers, 91.7% of all Mao Dun Literature Prize winners, and 68.3% of Olympic champions, with Beijing taking 63%, 37.2%, 47.9% and 5.7%, respectively.
All the above figures show that Beijing is home to many heavyweights in the cultural and entertainment field. The top talent and the high-quality facilities make Beijing a cultural and entertainment production center in China and give the city overwhelming lead in the culture, sports and entertainment radiation.
3. A comparison of cultural and tourism industries in China and Japan
In March 2018, the Ministry of Culture and Tourism was founded, combining the functions of the China National Tourism Administration and the Ministry of Culture, as part of the country’s effort to promote integrated development of the two industries.
To analyze their integrated development, we found a correlation coefficient of 0.55 between the 2019 ranking of culture, sports and entertainment radiation and inbound tourism. Correlation coefficients are used to measure the strength of the relationship between two variables. The stronger the association between the two variables, the closer the coefficient will incline toward 1, while 0.55 demonstrates a not so close relationship between the two.
Using the same method, we found a high correlation coefficient of 0.82 between the culture, sports and entertainment radiation for 47 prefectures in Japan and the country’s inbound tourism. A coefficient of over 0.8 indicates a very strong association between the two variables. That is to say, Japanese cities with stronger culture, sports and entertainment radiation attract more overseas tourists.
Compared to Japan, China’s culture and tourism industry is not as integrated as its neighbor.
After WWII, Japan built the world’s second largest economy based on manufacturing. In 2003, the Japanese government put forward the idea of making Japan a tourism-based country. That year, the number of inbound tourists was only 5.21 million, ranking 31st in the world.
The country’s tourism industry quickly took off and the number of inbound travel surged under the Abe administration. By 2019, the number of inbound visits surged to 31.88 million.
From 2003 to 2018, the number of inbound tourists in Japan grew by 500%, compared to 110% in Germany, 90% in China and the U.S., 60% in Spain and the U.K., and 20% in France. By 2018, Japan had ranked 11th in the number of inbound tourists, compared to 31st in 2003.
It’s interesting to see that there is a relatively low correlation coefficient of 0.45 between inbound travels and domestic travels in China while a relatively high correlation of 0.87 in that of Japan. A high correlation means that cities popular among inbound tourists is also popular among domestic tourists, while a low correlation is just the opposite.
One reason for the low correlations in China is that many of the inbound visits in Chinese mainland are Chinese compatriots from Hong Kong, Macao and Taiwan who travel frequently in coastal cities in Guangdong and Fujian, which has caused the "decoupling" of inbound and domestic travelers.
4. Manufacturing industry VS IT industry
After analyzing the correlation between the 2019 culture, sports and entertainment radiation and the manufacturing radiation based on 297 cities at prefecture level or above across China, we found a correlation coefficient of 0.43 between the cultural industry and the manufacturing industry, which is relatively low. The analysis of the 2019 culture, sports, entertainment radiation and manufacturing radiation for 47 prefectures in Japan found a coefficient of minus 0.5, showing a mutually exclusive relationship between the two industries. From the comparative analysis of the relationship between the cultural radiation and the manufacturing radiation in China and Japan, we saw that there is no interactive development pattern between the two industries in China or Japan.
In the early years of China’s reform and opening up, provinces and cities across China attracted foreign investment through arts and culture. Art shows and film festivals, for instance, were hosted to attracted foreign investors. Commenting the approach, Zhao Qizheng, who was the first director of the Management Committee of Pudong New Area, criticized that this practice was not feasible, because "men of letters and artists do not invest, and entrepreneurs do not watch shows." His judgement proved true, given that the economic structure back then was dominated by the manufacturing industry.
However, the relationship between the cultural industry and the IT industry is another picture, as the IT industry serves as the new driving force for the current economy. After analyzing the correlation between the 2019 culture, sports and entertainment radiation and the IT industry radiation of 297 cities at prefecture level or above cities in China, we found a coefficient of 0.94, showing a "complete correlation" relationship. The same analysis of 47 prefectures in Japan showed a correlation coefficient of 0.97 between them, higher than that of China. The analyses concluded that no matter in China or Japan, the IT industry must be located in a city with a strong cultural industry. The development of the two industries is closely related and develop synchronously.
5. Beijing Metropolitan Area VS Tokyo Metropolitan Area
Beijing has the peerless radiation of the cultural industry in China, so Beijing has to look to other top metropolises to find out the gap and then fine-tune its strategy. Today, in the global top metropolises, such as London, New York, Paris and Tokyo, the cultural industry has become a magnet and driving force for the IT industry, the financial industry, scientific and technological innovation, higher education, and corporate headquarters. In the future, Beijing should align itself with the world’s metropolises, build itself into the world’s top cultural and entertainment capital, and lead the development of the national interaction economy.
After comparing the Tokyo Metropolitan Area (hereinafter referred to as Tokyo circle) consisting of Tokyo, Kanagawa, Chiba and Saitama, and the Beijing Metropolitan Area (hereinafter referred to as Beijing), we found that the area of Beijing is 20% larger than that of Tokyo circle, but the population of Beijing, no matter by measure of permanent resident population or DID (Densely Inhabited District, which is defined as an area with a population of 5,000 or more per square kilometer), is only 60% of that of Tokyo circle. And its GDP is only 30% of that of Tokyo circle. The carbon dioxide emission of Beijing is 20% higher than that of Tokyo circle.
A further analysis found that Beijing’s per capita GDP is only half of that of Tokyo circle, but the per capita carbon dioxide emission is 2.1 times that of Tokyo circle, and the energy consumption per unit GDP is 7.4 times that of Tokyo circle. We concluded that Beijing still lags behind Tokyo in the industrial structure, energy structure, urban structure and lifestyle. Moreover, Beijing has a smaller share of cultural and tourism industries, largely because there is lack of interaction between the two industries. In this sense, Beijing should aim to become a global center of culture and tourism in the future.
In 2019, the number of inbound tourists to Beijing accounted for only 14% of that to Tokyo circle. From 2000 to 2019, the number of inbound tourists to Beijing increased from 2.82 million to 3.77 million, an increase of only 34%. However, during the same period, the number of inbound tourists to Tokyo (excluding Kanagawa, Chiba and Saitama counties) increased from 4.18 million to 14.1 million, an increase of 237%, cementing its position as a top destination for tourists around the world.
The huge boon brought by foreign tourists to Tokyo’s economy, lies not only in tourism spending, but also in the exchange between visitors and the interaction economy like the IT industry. Tokyo’s leading position in the IT industry is built on such an interaction.
As the above comparative analysis shows, Tokyo outperforms Beijing in terms of the number and the growth rate of inbound tourists. How to make Beijing more attractive is the key to building Beijing into a cultural and tourism metropolis.
To build a more appealing city, we need to use universal logical, concepts and methods to give insight into its own cultural characteristics.
For example, "eating" is a very important social communication scene in the interaction economy. Almost all the cities with a strong IT industry in the world are destinations for foodies. In fact, "eating well" is also the productivity of communication economy. Beijing is home to many famous restaurants with Chinese characteristics, but the number of the world’s top restaurants in the city is only 10% of that in Tokyo circle. Tokyo (excluding Kanagawa, Chiba and Saitama counties) has 219 Michelin-starred restaurants, more than any cities in the world. Moreover, 65% of those star restaurants serve Japanese cuisine, and many of their chefs have studied cooking skills overseas. Exchanges in the field of cooking led to the integration and mutual learning, rather than assimilation, between Japanese cuisine and Western cuisine. One of the main reasons why Japanese food is popular worldwide is that there are many Japanese chefs who have preserved their culture and created their style despite influences of other countries.
To know the world and to make itself known to the world holds the key for Beijing to become a world-class metropolis.
A look at Beijing’s cultural industry from its culture, sports and entertainment radiation
http://www.china.org.cn/china/2020-09/24/content_76736907.htm