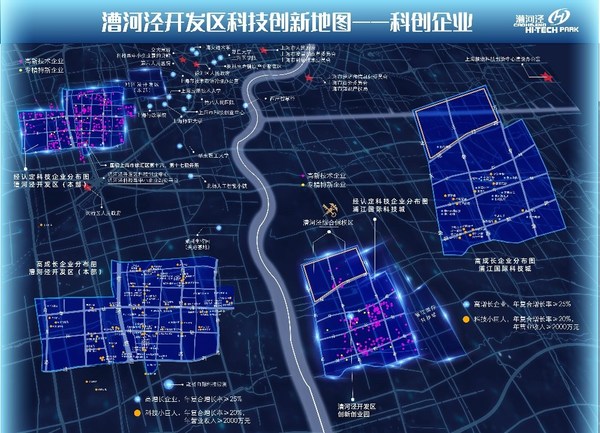
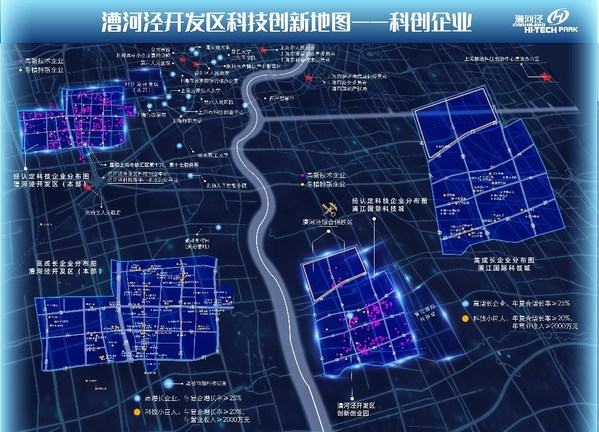
SHANGHAI, Jan. 15, 2021 /PRNewswire/ — On January 12, the 2020 Caohejing Hi-Tech Park Science and Technology Innovation Index Map was published and unveiled at the opening ceremony of the 5th Caohejing Hi-Tech Carnival. This event coincided with the release of the 4th issue of the park’s innovation index report series.
During the 13th Five-Year Plan, for the purpose of accurately representing the formation rules of global innovation centers in science and technology and accelerating the construction of important carrier and innovation clusters, Caohejing Hi-Tech Park focused on the basic framework of an innovation ecosystem and built a science and technology innovation index system with "six forces" at its core. Qualitative and quantitative analyses were conducted in areas of innovative economy growth, innovative resource aggregation, innovation outputs, innovative service improvement, innovative industry development and innovative environment construction. These studies objectively reflected the park’s performance in building the science and technology innovation center, providing typical insight and experience.
The park’s science and technology innovation index is calculated using 2011 as the base period (reference value of 60). According to the report, the index moved up to 186.8 as of the end of 2018 with 15.93% year-on-year growth. The compound annual growth rate during the 13th Five-Year Plan period was 13.55%. Across the measured indicators, six first-level indicators all saw rapid and steady growth. These indicators were: supporting force for science and technology innovation, demonstrating force of science and technology service, aggregating force of innovation platforms, pioneering force of innovation commercialization, leading force of emerging industries and benchmarking force of urban renewal.
Science and Technology Innovation Index PLUS
In 2020, the park adopted the concept of an "innovation map" in its science and technology innovation index. Indicator data and regional space resource distribution are combined to form the science and technology innovation enterprise map, innovative industry map, science and technology service technology, innovations map and fintech map, serving as the "instrument panel" and "navigator" for its innovation-driven development.
The index map focuses on science and technology innovation and future industry development, visually reflects the aggregation and interaction degree of various innovators and elements in the park and shows the independent innovation degree of enterprises and levels of high-tech products. In addition to this, it also represents the development of the park’s economy featuring new technologies, industries, business types and development patterns. At the same time, the index map is committed to strengthening the park’s brand by building an innovation information service center to guide the launch of innovation projects, distribution of innovation resources and participation of social capital.


