XIAMEN, China, Aug. 24, 2021 /PRNewswire/ — Qudian Inc. ("Qudian" or "the Company" or "We") (NYSE: QD), a leading technology platform empowering the enhancement of the online consumer finance experience in China, today announced its unaudited financial results for the quarter ended June 30, 2021.
Second Quarter 2021 Operational Highlights:
- Number of outstanding borrowers[1] from loan book business as of June 30, 2021 decreased by 3.8% to 2.9 million from 3.0 million as of March 31, 2021, as a result of the Company’s deployment of a conservative and prudent strategy
- Total outstanding loan balance from loan book business[2] decreased by 13.8% to RMB3.5 billion as of June 30, 2021, compared to the outstanding balance as of March 31, 2021
- Amount of transactions from loan book business for this quarter decreased by 12.1% to RMB3.9 billion from the first quarter of 2021; Amount of transactions serviced on open platform for this quarter decreased by 32.5% to RMB142.0 million from the first quarter of 2021
- Weighted average loan tenure for our loan book business was 4.4 months for this quarter, compared with 4.5 months in the first quarter of 2021; Weighted average loan tenure for transactions serviced on open platform was 6.2 months for this quarter, compared with 6.7 months in the first quarter of 2021
|
[1] Outstanding borrowers are borrowers who have outstanding loans from the Company’s loan book business as of a particular date. [2] Includes (i) off and on balance sheet loans directly or indirectly funded by our institutional funding partners or our own capital, net of cumulative write-offs and (ii) does not include auto loans from Dabai Auto business. |
Second Quarter 2021 Financial Highlights:
- Total revenues were RMB412.1 million (US$63.8 million), compared to RMB1,167.0 million from the same period of last year
- Net income attributable to Qudian’s shareholders was RMB269.9 million (US$41.8 million), representing an increase of 50.7% from the same period of last year, or RMB1.03 (US$0.16) per diluted ADS
- Non-GAAP net income attributable to Qudian’s shareholders[3] was RMB282.5 million (US$43.7 million), representing an increase of 844.0% from the same period of last year, or RMB1.07 (US$0.17) per diluted ADS
|
[3] For more information on this Non-GAAP financial measure, please see the table captioned "Unaudited Reconciliation of GAAP and Non-GAAP Results" set forth at the end of this press release. |
"During the second quarter of 2021, we analyzed evolving market dynamics and maintained a prudent approach to our cash credit business, ultimately generating total transaction volume of approximately RMB3.9 billion during the period," said Mr. Min Luo, Founder, Chairman and Chief Executive Officer of Qudian. "We are also delighted with WLM KIDS’ steady progress. We opened two new WLM KIDS activities centers in Fuzhou and Xiamen. As of August 24, 2021, we have three WLM KIDS activities centers in operation, and we have signed the lease agreements for another 37 WLM KIDS activities centers, of which 24 WLM KIDS activities centers are currently under renovation. Going forward, we will prudently manage WLM KIDS’ expansion and continue to deliver state-of-the-art extra-curriculum activities services and products to China’s children and families."
"As we continued to implement stringent credit approval standards and strategically shifted toward higher-quality borrowers, our asset quality further improved and the D1 delinquency rate[4] for our loan book business decreased to below 5% at the end of the second quarter. Looking ahead, we remain dedicated to controlling credit risk in our loan book business and committed to creating and delivering value to children, families and society with our extra-curriculum activities business," said Ms. Sissi Zhu, Vice President of Investor Relations of Qudian.
|
[4] "D1 delinquency rate" is defined as (i) the total amount of principal and financing service fees that became overdue as of a specified date, divided by (ii) the total amount of principal and financing services fees that was due for repayment as of such date, in each case with respect to our loan book business. |
Second Quarter Financial Results
Total revenues were RMB412.1 million (US$63.8 million), representing a decrease of 64.7% from RMB1,167.0 million for the second quarter of 2020.
Financing income totaled RMB311.8 million (US$48.3 million), representing a decrease of 46.3% from RMB580.9 million for the second quarter of 2020, as a result of the decrease in the average on-balance sheet loan balance.
Loan facilitation income and other related income decreased by 95.1% to RMB12.6 million (US$1.9 million) from RMB255.1 million for the second quarter of 2020, as a result of the reduction in transaction volume of off-balance sheet loans during this quarter.
Transaction services fee and other related income increased to RMB38.5 million (US$6.0 million) from RMB4.1 million for the second quarter of 2020, mainly as a result of the reassessment of variable consideration.
Sales income and others decreased to RMB23.7 million (US$3.7 million) from RMB293.3 million for the second quarter of 2020, mainly due to sales related to the Wanlimu e-commerce platform, which we are in the process of winding down.
Sales commission fee decreased by 37.0% to RMB9.1 million (US$1.4 million) from RMB14.4 million for the second quarter of 2020, due to the decrease in the amount of merchandise credit transactions.
Total operating costs and expenses decreased by 90.9% to RMB89.3 million (US$13.8 million) from RMB982.4 million for the second quarter of 2020.
Cost of revenues decreased by 82.3% to RMB64.9 million (US$10.1 million) from RMB366.4 million for the second quarter of 2020, primarily due to the decrease in costs associated with the loan book business and the decrease in cost of goods sold related to the Wanlimu e-commerce platform.
Sales and marketing expenses decreased by 81.4% to RMB29.1 million (US$4.5 million) from RMB156.8 million for the second quarter of 2020, primarily due to the decrease in marketing promotional expenses.
General and administrative expenses increased by 44.8% to RMB109.1 million (US$16.9 million) from RMB75.3 million for the second quarter of 2020, as a result of the increase in staff salaries primarily relating to WLM Kids business.
Research and development expenses decreased by 30.3% to RMB39.2 million (US$6.1 million) from RMB56.3 million for the second quarter of 2020, as a result of the decrease in staff salaries.
Provision for receivables and other assets was a reversal of RMB97.4 million (US$15.1 million), compared to a loss of RMB519.0 million for the second quarter of 2020, mainly due to the decrease in past-due on-balance sheet outstanding principal receivables compared to the second quarter of 2020.
As of June 30, 2021, the total balance of outstanding principal and financing service fee receivables for on-balance sheet transactions for which any installment payment was more than 30 calendar days past due was RMB147.5 million (US$22.8 million), and the balance of allowance for principal and financing service fee receivables at the end of the period was RMB374.3 million (US$58.0 million), indicating M1+ Delinquency Coverage Ratio of 2.5x.
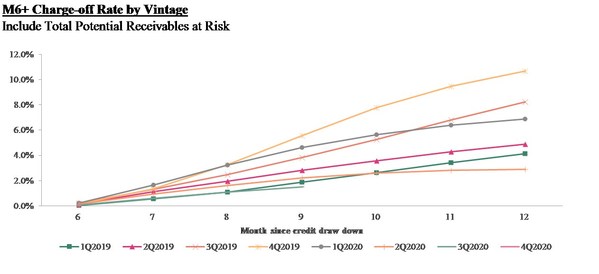
The following charts display the "vintage charge-off rate." Total potential receivables at risk vintage charge-off rate refers to, with respect to on- and off-balance sheet transactions facilitated under the loan book business during a specified time period, the total potential outstanding principal balance of the transactions that are delinquent for more than 180 days up to twelve months after origination, divided by the total initial principal of the transactions facilitated in such vintage. Delinquencies may increase or decrease after such 12-month period.
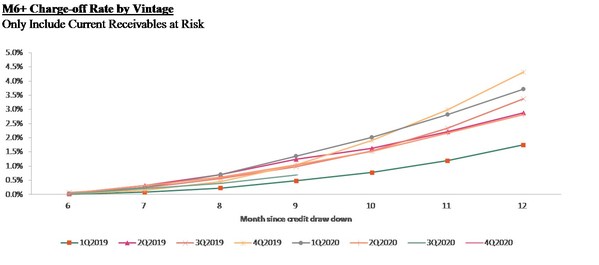
Current receivables at risk vintage charge-off rate refers to, with respect to on- and off-balance sheet transactions facilitated under the loan book business during a specified time period, the actual outstanding principal balance of the transactions that are delinquent for more than 180 days up to twelve months after origination, divided by the total initial principal of the transactions facilitated in such vintage. Delinquencies may increase or decrease after such 12-month period.
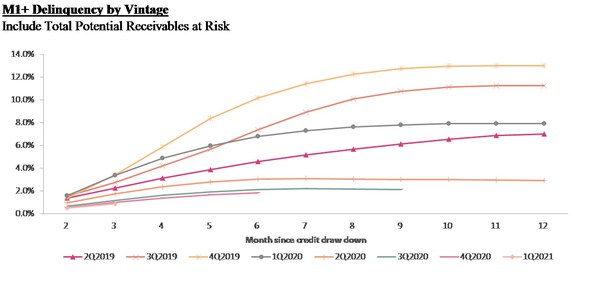
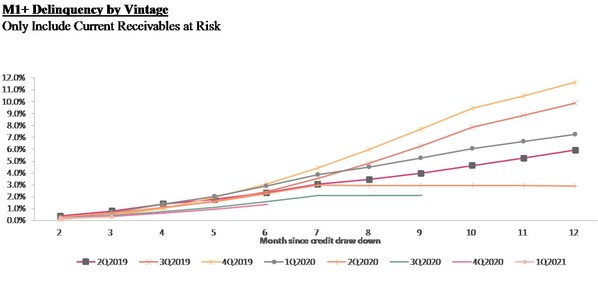
Total potential receivables at risk M1+ delinquency rate by vintage refers to, with respect to on- and off-balance sheet transactions facilitated under the loan book business during a specified time period, the total potential outstanding principal balance of the transactions that are delinquent for more than 30 days up to twelve months after origination, divided by the total initial principal of the transactions facilitated in such vintage. Delinquencies may increase or decrease after such 12-month period.
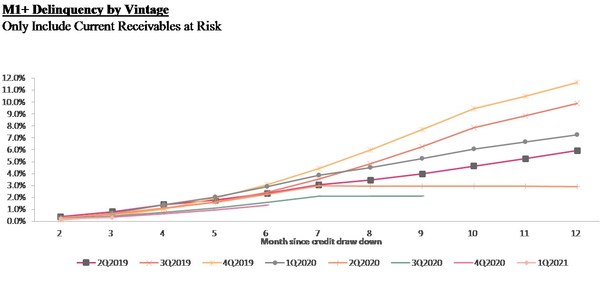
Current receivables at risk M1+ delinquency rate by vintage refers to, with respect to on- and off-balance sheet transactions facilitated under the loan book business during a specified time period, the actual outstanding principal balance of the transactions that are delinquent for more than 30 days up to twelve months after origination, divided by the total initial principal of the transactions facilitated in such vintage. Delinquencies may increase or decrease after such 12-month period.
Income from operations increased to RMB327.2 million (US$50.7 million) from RMB312.4 million for the second quarter of 2020.
Net income attributable to Qudian’s shareholders was RMB269.9 million (US$41.8 million), or RMB1.03 (US$0.16) per diluted ADS.
Non-GAAP net income attributable to Qudian’s shareholders was RMB282.5 million (US$43.7 million), or RMB1.07 (US$0.17) per diluted ADS.
Cash Flow
As of June 30, 2021, the Company had cash and cash equivalents of RMB3,133.6 million (US$485.3 million) and restricted cash of RMB296.9 million (US$46.0 million). Restricted cash mainly represents (i) cash held by the consolidated trusts through segregated bank accounts; and (ii) security deposits held in designated bank accounts for the guarantee of off-balance sheet transactions. Such restricted cash is not available to fund the general liquidity needs of the Company.
For the second quarter of 2021, net cash provided by operating activities was RMB570.3 million (US$88.3 million), mainly attributable to net income of RMB269.1 million (US$41.7 million). Net cash provided by investing activities was RMB456.8 million (US$70.7 million), mainly due to net proceeds from collection of loan principal and partially offset by net payments to originate loan principal. Net cash provided by financing activities was nil.
Conference Call
The Company’s management will host an earnings conference call on August 24, 2021 at 7:00 AM U.S. Eastern Time (7:00 PM Beijing/Hong Kong Time). Details for the conference call are as follows:
|
Title of Event: |
Qudian Inc. Second Quarter 2021 Earnings Conference Call |
|
Conference ID: |
9770439 |
|
Registration link: |
For participants who wish to join the call, please complete the online registration at least 15 minutes prior to the scheduled call start time. Upon registration, participants will receive the conference call access information, including participant dial-in numbers, a Direct Event Passcode, a unique Registrant ID, and an e-mail with detailed instructions to join the conference call.
Additionally, a live and archived webcast of the conference call will be available on the Company’s investor relations website at http://ir.qudian.com.
A replay of the conference call will be accessible approximately two hours after the conclusion of the live call until August 31, 2021, by dialing the following telephone numbers:
|
United States: |
+1-855-452-5696 (toll-free) / +1-646-254-3697 |
|||||
|
International: |
+61-2-8199-0299 |
|||||
|
Hong Kong, China: |
800-963-117 (toll-free) / +852-3051-2780 |
|||||
|
Mainland, China: |
400-632-2162 / 800-870-0205 (toll-free) |
|||||
|
Passcode: |
9770439 |
|||||
About Qudian Inc.
Qudian Inc. ("Qudian") is a leading technology platform empowering the enhancement of online consumer finance experience in China. The Company’s mission is to use technology to make personalized credit accessible to hundreds of millions of young, mobile-active consumers in China who need access to small credit for their discretionary spending but are underserved by traditional financial institutions due to lack of traditional credit data or high cost of servicing. Qudian’s credit solutions enable licensed, regulated financial institutions and ecosystem partners to offer affordable and customized loans to this young generation of consumers.
For more information, please visit http://ir.qudian.com.
Use of Non-GAAP Financial Measures
We use adjusted net income/loss, a Non-GAAP financial measure, in evaluating our operating results and for financial and operational decision-making purposes. We believe that adjusted net income/loss helps identify underlying trends in our business by excluding the impact of share-based compensation expenses, which are non-cash charges, and convertible bonds buyback income. We believe that adjusted net income/loss provides useful information about our operating results, enhances the overall understanding of our past performance and future prospects and allows for greater visibility with respect to key metrics used by our management in its financial and operational decision-making.
Adjusted net income/loss is not defined under U.S. GAAP and are not presented in accordance with U.S. GAAP. This Non-GAAP financial measure has limitations as analytical tools, and when assessing our operating performance, cash flows or our liquidity, investors should not consider them in isolation, or as a substitute for net loss / income, cash flows provided by operating activities or other consolidated statements of operation and cash flow data prepared in accordance with U.S. GAAP.
We mitigate these limitations by reconciling the Non-GAAP financial measure to the most comparable U.S. GAAP performance measure, all of which should be considered when evaluating our performance.
For more information on this Non-GAAP financial measure, please see the table captioned "Unaudited Reconciliation of GAAP and Non-GAAP Results" set forth at the end of this press release.
Exchange Rate Information
This announcement contains translations of certain RMB amounts into U.S. dollars ("US$") at specified rates solely for the convenience of the reader. Unless otherwise stated, all translations from RMB to US$ were made at the rate of RMB6.4566 to US$1.00, the noon buying rate in effect on June 30, 2021 in the H.10 statistical release of the Federal Reserve Board. The Company makes no representation that the RMB or US$ amounts referred could be converted into US$ or RMB, as the case may be, at any particular rate or at all.
Statement Regarding Preliminary Unaudited Financial Information
The unaudited financial information set out in this earnings release is preliminary and subject to potential adjustments. Adjustments to the consolidated financial statements may be identified when audit work has been performed for the Company’s year-end audit, which could result in significant differences from this preliminary unaudited financial information.
Safe Harbor Statement
This announcement contains forward-looking statements. These statements are made under the "safe harbor" provisions of the United States Private Securities Litigation Reform Act of 1995. These forward-looking statements can be identified by terminology such as "will," "expects," "anticipates," "future," "intends," "plans," "believes," "estimates" and similar statements. Among other things, the expectation of its collection efficiency and delinquency, contain forward-looking statements. Qudian may also make written or oral forward-looking statements in its periodic reports to the SEC, in its annual report to shareholders, in press releases and other written materials and in oral statements made by its officers, directors or employees to third parties. Statements that are not historical facts, including statements about Qudian’s beliefs and expectations, are forward-looking statements. Forward-looking statements involve inherent risks and uncertainties. A number of factors could cause actual results to differ materially from those contained in any forward-looking statement, including but not limited to the following: Qudian’s goal and strategies; Qudian’s expansion plans; Qudian’s future business development, financial condition and results of operations; Qudian’s expectations regarding demand for, and market acceptance of, its credit products; Qudian’s expectations regarding keeping and strengthening its relationships with borrowers, institutional funding partners, merchandise suppliers and other parties it collaborate with; general economic and business conditions; and assumptions underlying or related to any of the foregoing. Further information regarding these and other risks is included in Qudian’s filings with the SEC. All information provided in this press release and in the attachments is as of the date of this press release, and Qudian does not undertake any obligation to update any forward-looking statement, except as required under applicable law.
For investor and media inquiries, please contact:
Qudian Inc.
Tel: +86-592-596-8208
E-mail: [email protected]
The Piacente Group, Inc.
Jenny Cai
Tel: +86 (10) 6508-0677
E-mail: [email protected]
The Piacente Group, Inc.
Brandi Piacente
Tel: +1-212-481-2050
E-mail: [email protected]
|
QUDIAN INC. |
|||||||
|
Unaudited Condensed Consolidated Statements of Operations |
|||||||
|
Three months ended June 30, |
|||||||
|
(In thousands except for number |
2020 |
2021 |
|||||
|
of shares and per-share data) |
(Unaudited) |
(Unaudited) |
(Unaudited) |
||||
|
RMB |
RMB |
US$ |
|||||
|
Revenues: |
|||||||
|
Financing income |
580,856 |
311,755 |
48,285 |
||||
|
Sales commission fee |
14,404 |
9,081 |
1,406 |
||||
|
Sales income and others |
293,292 |
23,655 |
3,664 |
||||
|
Penalty fee |
19,335 |
16,569 |
2,566 |
||||
|
Loan facilitation income and other related income |
255,063 |
12,565 |
1,946 |
||||
|
Transaction services fee and other related income |
4,098 |
38,462 |
5,957 |
||||
|
Total revenues |
1,167,048 |
412,087 |
63,824 |
||||
|
Operating cost and expenses: |
|||||||
|
Cost of revenues |
(366,381) |
(64,890) |
(10,050) |
||||
|
Sales and marketing |
(156,806) |
(29,140) |
(4,513) |
||||
|
General and administrative |
(75,334) |
(109,112) |
(16,899) |
||||
|
Research and development |
(56,265) |
(39,204) |
(6,072) |
||||
|
Changes in guarantee liabilities and risk assurance liabilities(1) |
191,420 |
55,624 |
8,615 |
||||
|
Provision for receivables and other assets |
(519,014) |
97,385 |
15,083 |
||||
|
Total operating cost and expenses |
(982,380) |
(89,337) |
(13,836) |
||||
|
Other operating income |
127,698 |
4,482 |
694 |
||||
|
Income from operations |
312,366 |
327,232 |
50,682 |
||||
|
Interest and investment income/(loss), net |
(65,758) |
17,713 |
2,743 |
||||
|
Foreign exchange income, net |
4,960 |
319 |
49 |
||||
|
Other income |
10,059 |
85 |
14 |
||||
|
Other expenses |
(94) |
(750) |
(116) |
||||
|
Net income before income taxes |
261,533 |
344,599 |
53,372 |
||||
|
Income tax expenses |
(82,371) |
(75,457) |
(11,687) |
||||
|
Net income |
179,162 |
269,142 |
41,685 |
||||
|
Less: net loss attributable to non-controlling |
– |
(805) |
(124) |
||||
|
Net income attributable to Qudian Inc.’s |
179,162 |
269,947 |
41,809 |
||||
|
Earnings per share for Class A and Class B |
|||||||
|
Basic |
0.71 |
1.07 |
0.17 |
||||
|
Diluted |
0.68 |
1.03 |
0.16 |
||||
|
Earnings per ADS (1 Class A ordinary share |
|||||||
|
Basic |
0.71 |
1.07 |
0.17 |
||||
|
Diluted |
0.68 |
1.03 |
0.16 |
||||
|
Weighted average number of Class A and Class B |
|||||||
|
Basic |
253,724,694 |
253,370,503 |
253,370,503 |
||||
|
Diluted |
272,190,273 |
266,973,780 |
266,973,780 |
||||
|
Other comprehensive loss: |
|||||||
|
Foreign currency translation adjustment |
(10,165) |
(7,087) |
(1,098) |
||||
|
Total comprehensive income |
168,997 |
262,055 |
40,587 |
||||
|
Less: total comprenhensive loss attributable to |
– |
(805) |
(124) |
||||
|
Total comprehensive income attributable to |
168,997 |
262,860 |
40,711 |
||||
|
Note? |
|||||||
|
QUDIAN INC. |
||||||
|
Unaudited Condensed Consolidated Balance Sheets |
||||||
|
As of March 31, |
As of June 30, |
|||||
|
(In thousands except for number |
2021 |
2021 |
||||
|
of shares and per-share data) |
(Unaudited) |
(Unaudited) |
(Unaudited) |
|||
|
RMB |
RMB |
US$ |
||||
|
ASSETS: |
||||||
|
Current assets: |
||||||
|
Cash and cash equivalents |
2,187,502 |
3,133,623 |
485,336 |
|||
|
Restricted cash |
234,112 |
296,915 |
45,986 |
|||
|
Short-term investments |
5,079,154 |
5,024,942 |
778,264 |
|||
|
Short-term loan principal and financing service fee receivables |
3,515,293 |
3,150,299 |
487,919 |
|||
|
Short-term finance lease receivables |
128,830 |
88,805 |
13,754 |
|||
|
Short-term contract assets |
50,077 |
26,422 |
4,092 |
|||
|
Other current assets |
1,006,670 |
679,604 |
105,258 |
|||
|
Total current assets |
12,201,638 |
12,400,610 |
1,920,609 |
|||
|
Non-current assets: |
||||||
|
Long-term finance lease receivables |
11,795 |
3,818 |
591 |
|||
|
Operating lease right-of-use assets |
296,253 |
526,259 |
81,507 |
|||
|
Investment in equity method investee |
381,287 |
367,148 |
56,864 |
|||
|
Long-term investments |
243,668 |
243,668 |
37,739 |
|||
|
Property and equipment, net |
359,955 |
436,007 |
67,529 |
|||
|
Intangible assets |
8,926 |
8,733 |
1,353 |
|||
|
Long-term contract assets |
10,317 |
6,154 |
953 |
|||
|
Deferred tax assets, net |
119,138 |
68,231 |
10,568 |
|||
|
Other non-current assets |
425,464 |
463,042 |
71,717 |
|||
|
Total non-current assets |
1,856,803 |
2,123,060 |
328,821 |
|||
|
TOTAL ASSETS |
14,058,441 |
14,523,670 |
2,249,430 |
|||
|
QUDIAN INC. |
||||||
|
Unaudited Condensed Consolidated Balance Sheets |
||||||
|
As of March 31, |
As of June 30, |
|||||
|
(In thousands except for number |
2021 |
2021 |
||||
|
of shares and per-share data) |
(Unaudited) |
(Unaudited) |
(Unaudited) |
|||
|
RMB |
RMB |
US$ |
||||
|
LIABILITIES AND SHAREHOLDERS’ EQUITY |
||||||
|
Current liabilities: |
||||||
|
Short-term lease liabilities |
41,543 |
51,388 |
7,959 |
|||
|
Accrued expenses and other current liabilities |
351,417 |
415,047 |
64,283 |
|||
|
Guarantee liabilities and risk assurance liabilities(1) |
21,583 |
3,252 |
504 |
|||
|
Income tax payable |
100,054 |
34,354 |
5,320 |
|||
|
Total current liabilities |
514,597 |
504,041 |
78,066 |
|||
|
Non-current liabilities: |
||||||
|
Deferred tax liabilities, net |
18,564 |
12,182 |
1,887 |
|||
|
Convertible senior notes |
827,555 |
817,685 |
126,643 |
|||
|
Long-term lease liabilities |
152,184 |
369,666 |
57,254 |
|||
|
Long-term borrowings and interest payables |
145,312 |
145,312 |
22,506 |
|||
|
Total non-current liabilities |
1,143,615 |
1,344,845 |
208,290 |
|||
|
Total liabilities |
1,658,212 |
1,848,886 |
286,356 |
|||
|
Shareholders’ equity: |
||||||
|
Class A Ordinary shares |
132 |
132 |
20 |
|||
|
Class B Ordinary shares |
44 |
44 |
7 |
|||
|
Treasury shares |
(368,681) |
(352,533) |
(54,600) |
|||
|
Additional paid-in capital |
4,014,320 |
4,010,672 |
621,174 |
|||
|
Accumulated other comprehensive loss |
(49,160) |
(56,247) |
(8,711) |
|||
|
Retained earnings |
8,793,741 |
9,063,688 |
1,403,786 |
|||
|
Total Qudian Inc. shareholders’ equity |
12,390,396 |
12,665,756 |
1,961,676 |
|||
|
Non-controlling interests |
9,833 |
9,028 |
1,398 |
|||
|
Total equity |
12,400,229 |
12,674,784 |
1,963,074 |
|||
|
TOTAL LIABILITIES AND SHAREHOLDERS’ EQUITY |
14,058,441 |
14,523,670 |
2,249,430 |
|||
|
Note: |
||||||
|
QUDIAN INC. |
|||||||
|
Unaudited Reconciliation of GAAP And Non-GAAP Results |
|||||||
|
Three months ended June 30, |
|||||||
|
2020 |
2021 |
||||||
|
(In thousands except for number |
(Unaudited) |
(Unaudited) |
(Unaudited) |
||||
|
of shares and per-share data) |
RMB |
RMB |
US$ |
||||
|
Total net income attributable to Qudian Inc.’s shareholders |
179,162 |
269,947 |
41,809 |
||||
|
Add: Share-based compensation expenses |
20,269 |
12,505 |
1,937 |
||||
|
Less: Convertible bonds buyback income |
169,511 |
– |
– |
||||
|
Non-GAAP net income attributable to Qudian Inc.’s shareholders |
29,920 |
282,452 |
43,746 |
||||
|
Non-GAAP net income per share—basic |
0.12 |
1.11 |
0.17 |
||||
|
Non-GAAP net income per share—diluted |
0.12 |
1.07 |
0.17 |
||||
|
Weighted average shares outstanding—basic |
253,724,694 |
253,370,503 |
253,370,503 |
||||
|
Weighted average shares outstanding—diluted |
253,724,694 |
266,973,780 |
266,973,780 |
||||
Related Links :
http://ir.qudian.com
For more information, see our complete guide on CLPS Incorporation Reports Financial Results for the Second Half and Full Year of Fiscal 2022.